Shares of International Business Machines (IBM) are soaring northward this Thursday morning. The company announced that they will be spinning off the Managed Infrastructure Services unit of its Global Technology Services operation into a new public company. The tax-free deal is expected to be completed by the end of next year. Big Blue also said they see Q3 adjusted EPS of $2.58 vs. consensus of $2.58, and revenue of $17.6 billion vs. $17.56 billion consensus.
Let’s check and see what this is doing for the charts and indicators.
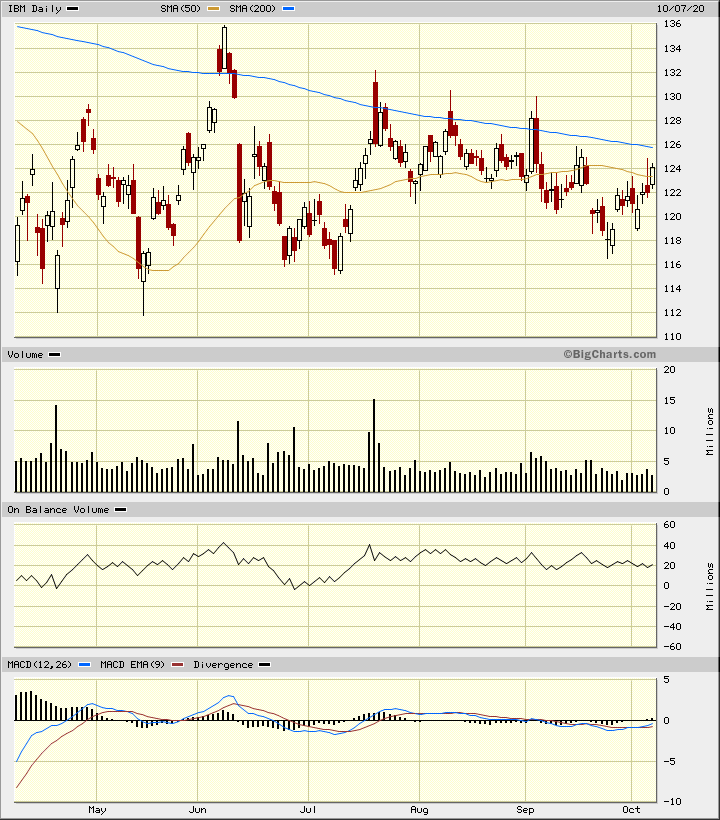
In this daily Japanese candlestick chart of IBM, below, we can see that prices have been making lower highs for months around the intersection of the declining 200-day moving average line. Prices have crisscrossed the 50-day moving average line numerous times since June. We can see bullish reversal patterns at all the key lows – a bullish engulfing pattern in early July and another one in late September stand out to me.
The On-Balance-Volume (OBV) line has been pretty stable since the middle of July and suggests that buyers and sellers are in balance. The OBV line is likely to turn upwards today.
The trend-following Moving Average Convergence Divergence (MACD) oscillator is just below the zero line and we could quickly get a crossing of the zero line and a buy signal.

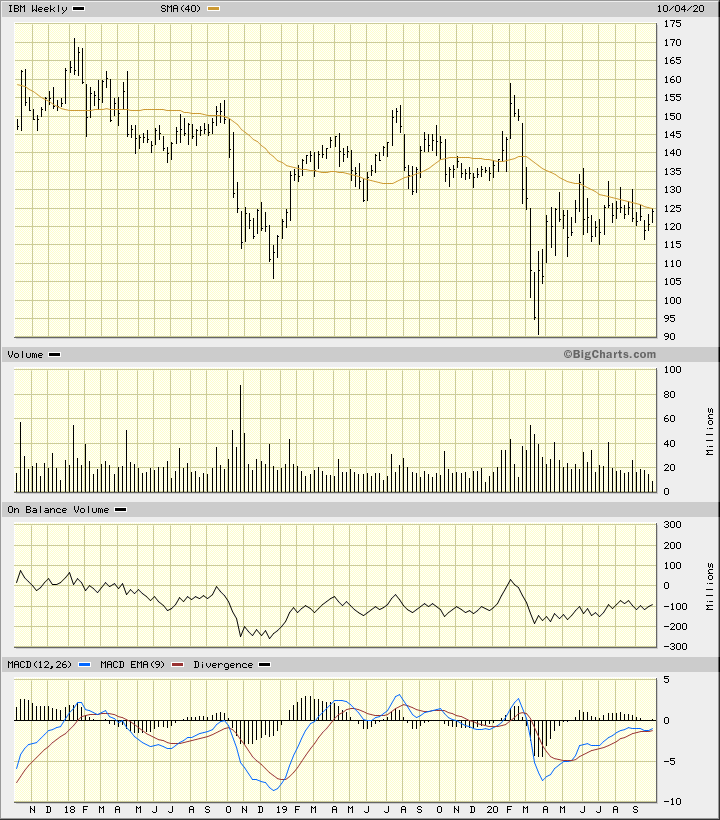
In this weekly bar chart of IBM, below, we can imagine that prices are above the declining 40-week moving average line.
The weekly OBV line shows a slow rise from March with higher lows the past seven months.
The MACD oscillator is still below the zero line but pointed up towards it.

In this daily Point and Figure chart of IBM, below, we can see the recent move up. A trade at $135.28 will be a breakout on this chart and could open the way to a $160 price target.

Bottom line strategy: Aggressive traders could try to buy an intraday dip today to the $132 area risking below $122. The $160 area is our Point and Figure price target.
Get an email alert each time I write an article for Real Money. Click the “+Follow” next to my byline to this article.


